CEM Insights
Does responsible investing hurt performance?
An analysis of PRI and Non-PRI signatories from a
$10.3 trillion database.
July 07, 2021
As Responsible Investing AUM keeps increasing across the globe, key questions around performance start to surface. What do we know about performance up to now?
By Kam Mangat, CFA
CEM Benchmarking - July 07, 2021
Responsible investing is becoming increasingly important and large asset owners are determining how best to implement ESG factors into the investment process and communicate the impact to stakeholders. A key question has been what is the impact of responsible investing on performance?
To date, this has been a hard question to answer. Most performance databases and ESG data sets are unconnected – and combining different sources may lead to unreliable conclusions. CEM, on the other hand, is in a unique position to start evaluating the trends in responsible investing. The CEM database includes 340 funds from across the globe with over USD$10 trillion in assets where funds have provided data according to standardized definitions that are thoroughly vetted. Many of these funds are also signatories to the Principles of Responsible Investing (PRI) where these funds adhere to six key principles of integrating ESG into the investment process and these funds file regular reports on their progress.
This allows CEM to use PRI signatories as a proxy for funds that have implemented responsible investing and compare them to funds that have not. The key to this analysis is that the return and cost data provided by all funds is based on the same definitions, allowing for an apples-to-apples comparison between the two groups.
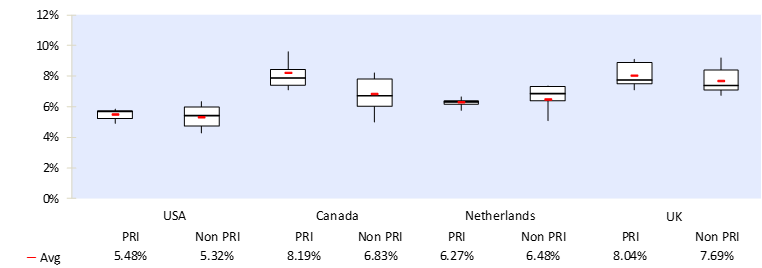
For net returns, CEM found that being a PRI signatory did not hurt performance. In fact, PRI signatories had better performance across most regions, on average, during the 5-year period ending 2018.
5 Year Average Net Return
Net return is after costs
Key highlights:
• PRI signatories had a higher 5-year average net return in USA, Canada, and the UK. In the Netherlands, PRI signatories had slightly lower returns, but this appears to be primarily because Non-PRI signatories in the Netherlands had larger fixed income allocations focused on immunizing their liabilities.
• The fact that PRI signatories in the CEM database did well over a 5-year period is encouraging, however, note that responsible investing is primarily focused on long-term performance and risks, and we need more time series data to understand the implications on long-term performance.
• As part of the analysis, we reviewed annual performance by year and found that the average net annual return for PRI and non-PRI signatories in all 4 countries followed a similar trend from 2014-2018. While there are differences in some years between PRI and non-PRI signatories, these differences did not carry across regions. In other words, there is no evidence of responsible investing impacting performance across global investors in any year.
For more detailed analysis on differences between PRI signatories and non-PRI signatories, including costs and net value-added comparisons, characteristics of PRI signatories, PRI assessment scores, and our 360° view integrating all the analysis, please download our full report here.
About CEM Benchmarking
CEM Benchmarking is an independent provider of cost, performance, administration, and transparency benchmarking information for pension funds and other institutional asset owners worldwide. We believe ‘what gets measured gets managed’ and are deeply committed to helping clients run cost-effective operations that generate value for their stakeholders. With vast industry knowledge and a 28-year, $15 Trillion AUM proprietary database, our team has helped more than half of the world’s top 300 pension schemes understand and manage their costs and performance. We also share cutting edge research and best practices with one goal in mind: Contributing every day to improving pension outcomes.
© Copyright 2021. CEM Benchmarking. All Rights Reserved.

